oMEDA
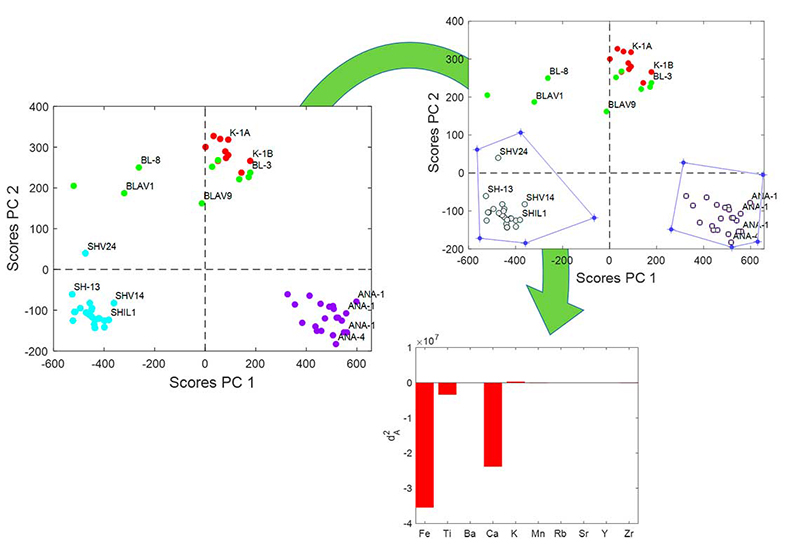
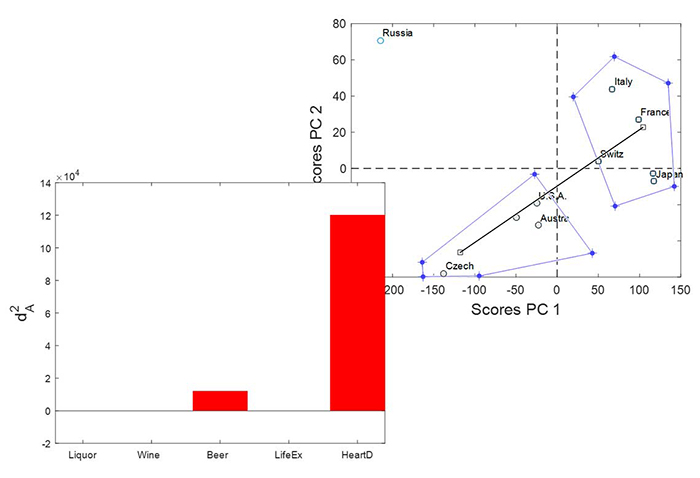
oMEDA is an exploratory tool to identify the variables related to specific artefacts, like clusters, trends or outliers, found in the projection of the data in a given subspace. This subspace could be determined by PCA, PLS and other related methods. oMEDA can also be used as a diagnosis tool in Multivariate Statistical Process Control (MSPC). An oMEDA plot is a bar plot where the contribution of variables to the artifact under study is represented. These contributions have sign information.
oMEDA is a variant of MEDA to connect observations and variables. Basically, oMEDA is a MEDA algorithm applied over a combination of the original data and a dummy variable designed to cover the observations of interest -- those that show the artefact. Take the following example: a number of subsets of observations {C1, ...,CN} form different clusters in the scores plot which are located far from the bulk of the data, L. One may be interested in identifying, for instance, the variables related to the deviation of C1 from L without considering the rest of clusters. For that, a dummy variable d is created so that observations in C1 are set to 1, observations in L are set to -1, while the remaining observations are left to 0. Also, values other than 1 and -1, in the form of weights, can be included in the dummy variable if desired. This is useful to diagnose linear trends in score plots. oMEDA is then performed using this dummy variable.