
CSP
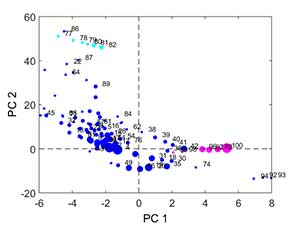
The Compressed Score Plots (CSP) are clustered versions of score plots to make possible the visualization of huge data sets. The objective is to retain the visualization capabilities of traditional score plots while making the user-supervised analysis of huge data sets affordable in a similar time scale to that of low size data sets. Using a CSP, there is no limit on the number of observations that can be visualized.
An example of CSP of the KDD example included in the MEDA Toolbox is shown in the Figure. The data set contains 5M observations and more than one hundred variables. The data are arranged in three classes. Larger markers represent clusters of higher cardinality.