SVI
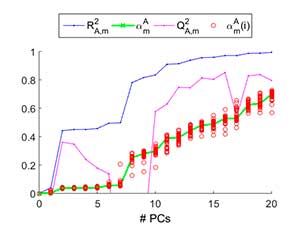
The SVI plots combine variance information with structural information to elucidate how a PCA model captures the variance of each single variable. The SVI plot of a variable v reveals how the following indices evolve with the addition of PCs in the PCA model:
- TheR2 statistic, which measures the variance of v.
- The Q2 statistic, which measures the performance of the missing data imputation of v, or otherwise stated its prediction performance.
- The α statistic, which measures the portion of variance of v which is identified as uniquevariance, i.e. variance not shared with other variables.
- The stability of α, as an indicator of the stability of the model calibration.
The Figure shows an example of SVI plot in a data set for Quantitative Structure-Activity Relationship (QSAR) modelling. The plot shows that the model remains quite stable until 5-6 PCs are included. This is seen in the closeness of the circles which represents the different instances of α computed on a leave-one-out cross-validation run. The main portion of variability in the response is captured in the second and eighth PCs. Nevertheless, is not until the tenth PC that the missing data imputation (Q2) yields a high value. For more PCs, the captured variability is only slightly augmented.